
What Copilot's local session logs reveal about flow efficiency in AI-assisted development - and a framework for turning that data into coaching conversations.
One of the core principles behind the engineering intelligence tools I spent years building at GitPrime and Pluralsight Flow was borrowed directly from Lean manufacturing: make work visible. Taiichi Ohno, the architect of the Toyota Production System, famously drew a chalk circle on the factory floor and had managers stand in it to see waste - inventory piling up, delays, and handoffs - making barriers to flow visible. In knowledge work, however, those queues are invisible. We rely on software engineering metrics (like cycle time, queue time, backflow, and time-in-state) to reveal where work is waiting vs. progressing, helping us reduce non-value-added time and improve flow efficiency.
When AI coding assistants arrived, I expected Software Engineering Intelligence to evolve alongside them. There's growing consensus that AI-assisted coding shifts the bottleneck from writing code to deciding, validating, and integrating it, which means traditional flow metrics focused on work volume have less meaning. The new macro-level indicators are prompt-to-PR latency, review and rework cycles, defect escape rates, and time spent validating AI outputs versus delivering value. But answering "are our engineering teams actually getting value from AI coding agents?" requires a second front: a micro-level view of how individual engineers interact with those tools. That level complements traditional flow metrics by revealing the cognitive and coordination friction inside the "black box" of individual work - enabling coaching that connects how engineers collaborate with AI to how work actually flows end-to-end.
The case is concrete. A 2025 study by METR found that experienced developers expected AI tools to make them about 24% faster - they were actually 19% slower. Making interaction patterns visible is one of the most direct ways to close that gap: it turns invisible work (waiting on prompts, approvals, or context switches) into something concrete that developers can reflect on and adjust. When engineers can see where time is really going, the behaviors tend to follow on their own: clearer prompts, less multitasking, fewer context switches.
We built that measurement framework at GitPrime and Pluralsight Flow. Ten years later, I wanted to know if the same principles applied somewhere they've never been applied - so I started with my own data.
What I Built
I use Claude Code and Cursor for most of my personal projects, but I started this analysis with GitHub Copilot - it was the approved tool at my last two organizations, and with over 20 million users and the majority of Fortune 500 companies on it, it's the right baseline for enterprise AI-assisted development. When used as a VS Code plugin, Copilot quietly stores detailed session logs on your local machine as JSON files in your workspace storage directory. These files aren't documented anywhere - I stumbled on them by accident - but they're a goldmine: every prompt, every tool the agent invokes, every file it touches, every response it generates, and the timing of each action, all sitting on your machine. The one gap is that they don't include token counts or cost data, which limits some analyses but doesn't affect the flow and interaction metrics I care about.
I built a pipeline to parse those logs and turn them into a dashboard. The unit of analysis is what I call a segment - one human prompt, plus all the agent's tool calls and responses that follow, until either the agent signals completion, an error occurs, or the next human message arrives. It's the atomic unit of a Copilot session: one question, one attempt, one outcome. The session data is a sequence of segments; all the metrics are computed from those segments.
The architecture separates what I think of as the deterministic spine from the LLM overlays. Core metrics - queue time, blocked segment share, tool call counts, context switch gaps - are computed using pure timestamp arithmetic and event counting. The raw data is the ground truth: queue time is a timestamp subtraction, whether an approval gate fired is a boolean in the log. LLM annotations layer on top to answer the interpretive questions: what was this developer trying to accomplish? Did they succeed on the first try? Was the prompt specific enough to produce a useful response?
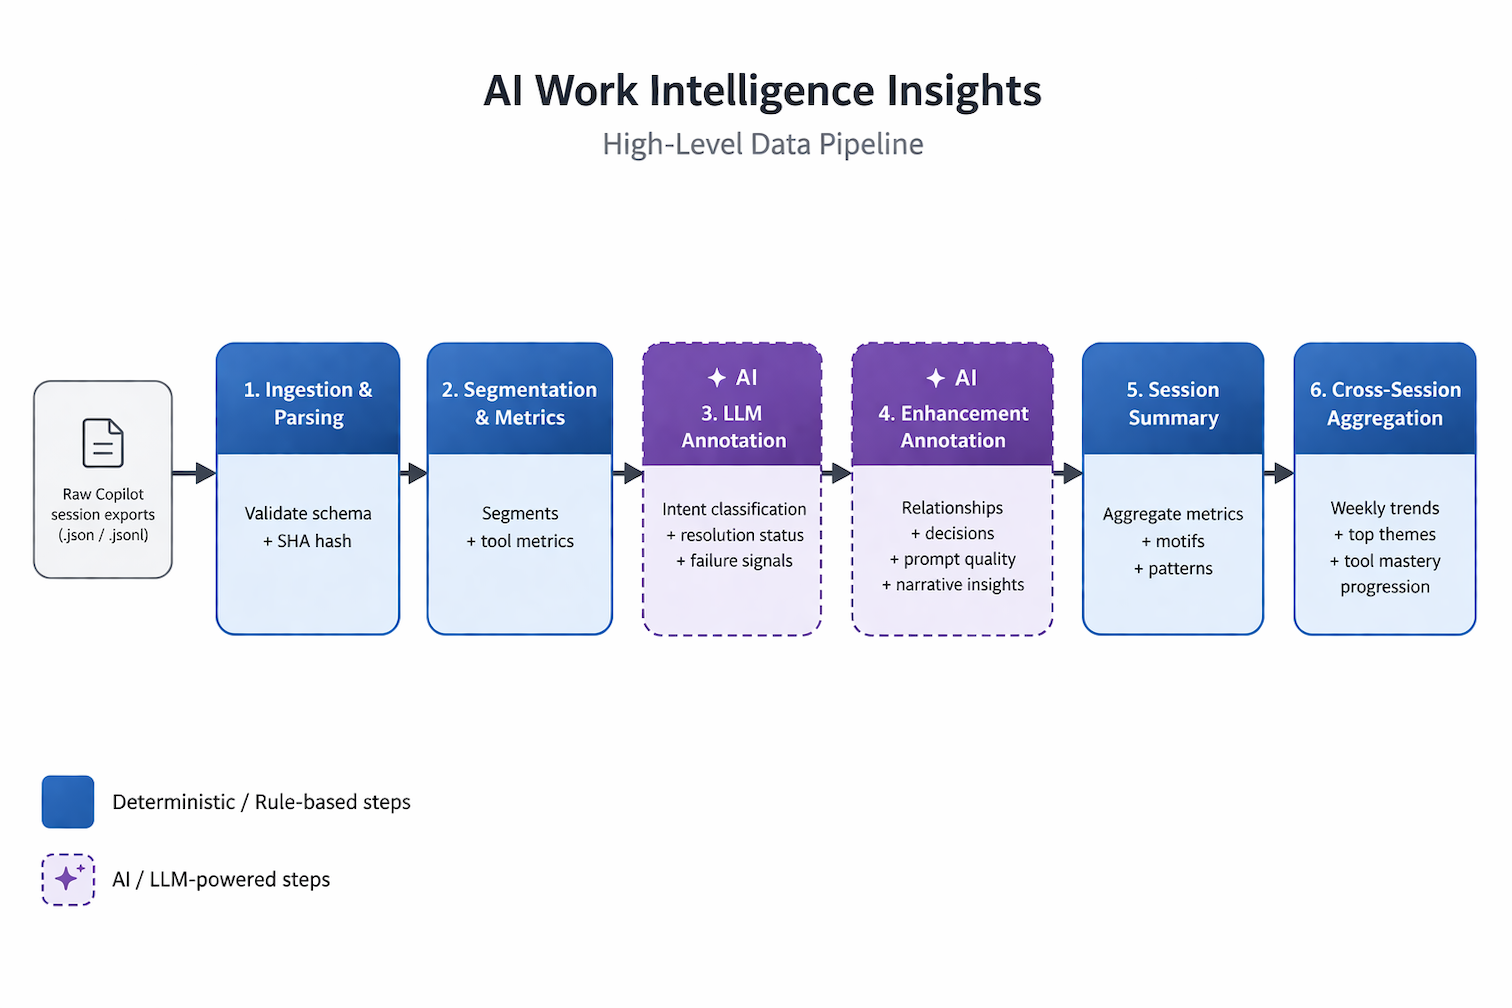
The pipeline from raw Copilot session exports to cross-session insights. Blue stages are deterministic; purple stages are LLM-powered.
In a 1:1, that distinction matters. When I tell an engineer their average queue time was 7.3 minutes, I'm asking them to trust a clock, not a model's judgment. You lead with the deterministic data. You use the interpretive layer to understand why.
I wrote the MVP over a long weekend, collaborating with GitHub Copilot on architectural decisions and using agent mode for implementation. Any engineering manager or Staff+ engineer could build something like this - the data is already on your developers' machines, and the infrastructure to read it is a weekend project.
The framework has three layers. The deterministic spine is just arithmetic: timestamps and event counts from the raw log, no model involved. The LLM overlay classifies and interprets - what was the developer trying to accomplish, did they succeed, how specific was the prompt - and it's always labeled as directional signal rather than ground truth. The archetype layer groups developers by interaction pattern, giving each a characteristic failure mode and a specific coaching focus. More on that in a minute.
What I Found
Across 14 sessions and 470 interaction segments, here's what my dashboard surfaced:
A note on terms: queue time is the total elapsed time for a segment - AI processing plus any waiting after the agent responded, including approval waits. A blocked segment is one where the agent had finished and was waiting on a manual approval, or had been idle for more than a minute. Productive time is active session time minus time spent in iteration chains (repeated attempts at the same task). Context switch gap is the elapsed time between consecutive segments.
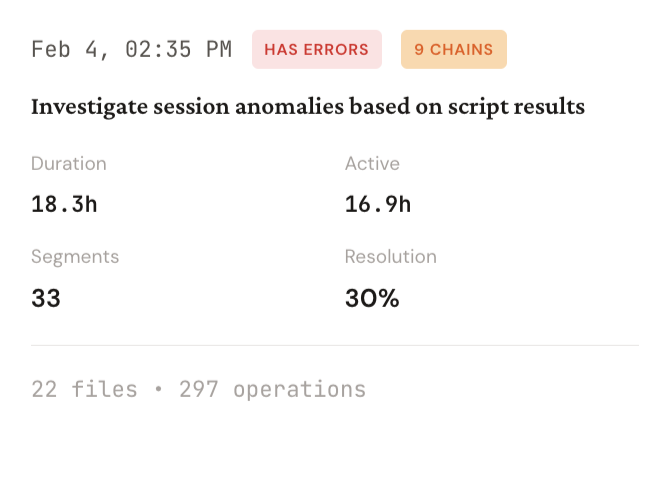 *One session, summarized. 18 hours elapsed, 297 agent operations, 30% resolution.*
- Average queue time: 7.3 minutes per segment
- Median queue time: 22.8 seconds
- Blocked segments share: 41.7%
- Productive (value-added) time: 4%
- Resolution rate: 50%
- Avg context switch gap: 1.7 hours between sessions
The mean-median gap is where to start. Most of my interactions were fast. A handful of severely delayed ones were pulling the average up. When I dug into what caused the long tail, the answer was never AI latency: it was that I had stopped responding.
Every Long Segment Was Waiting on Me
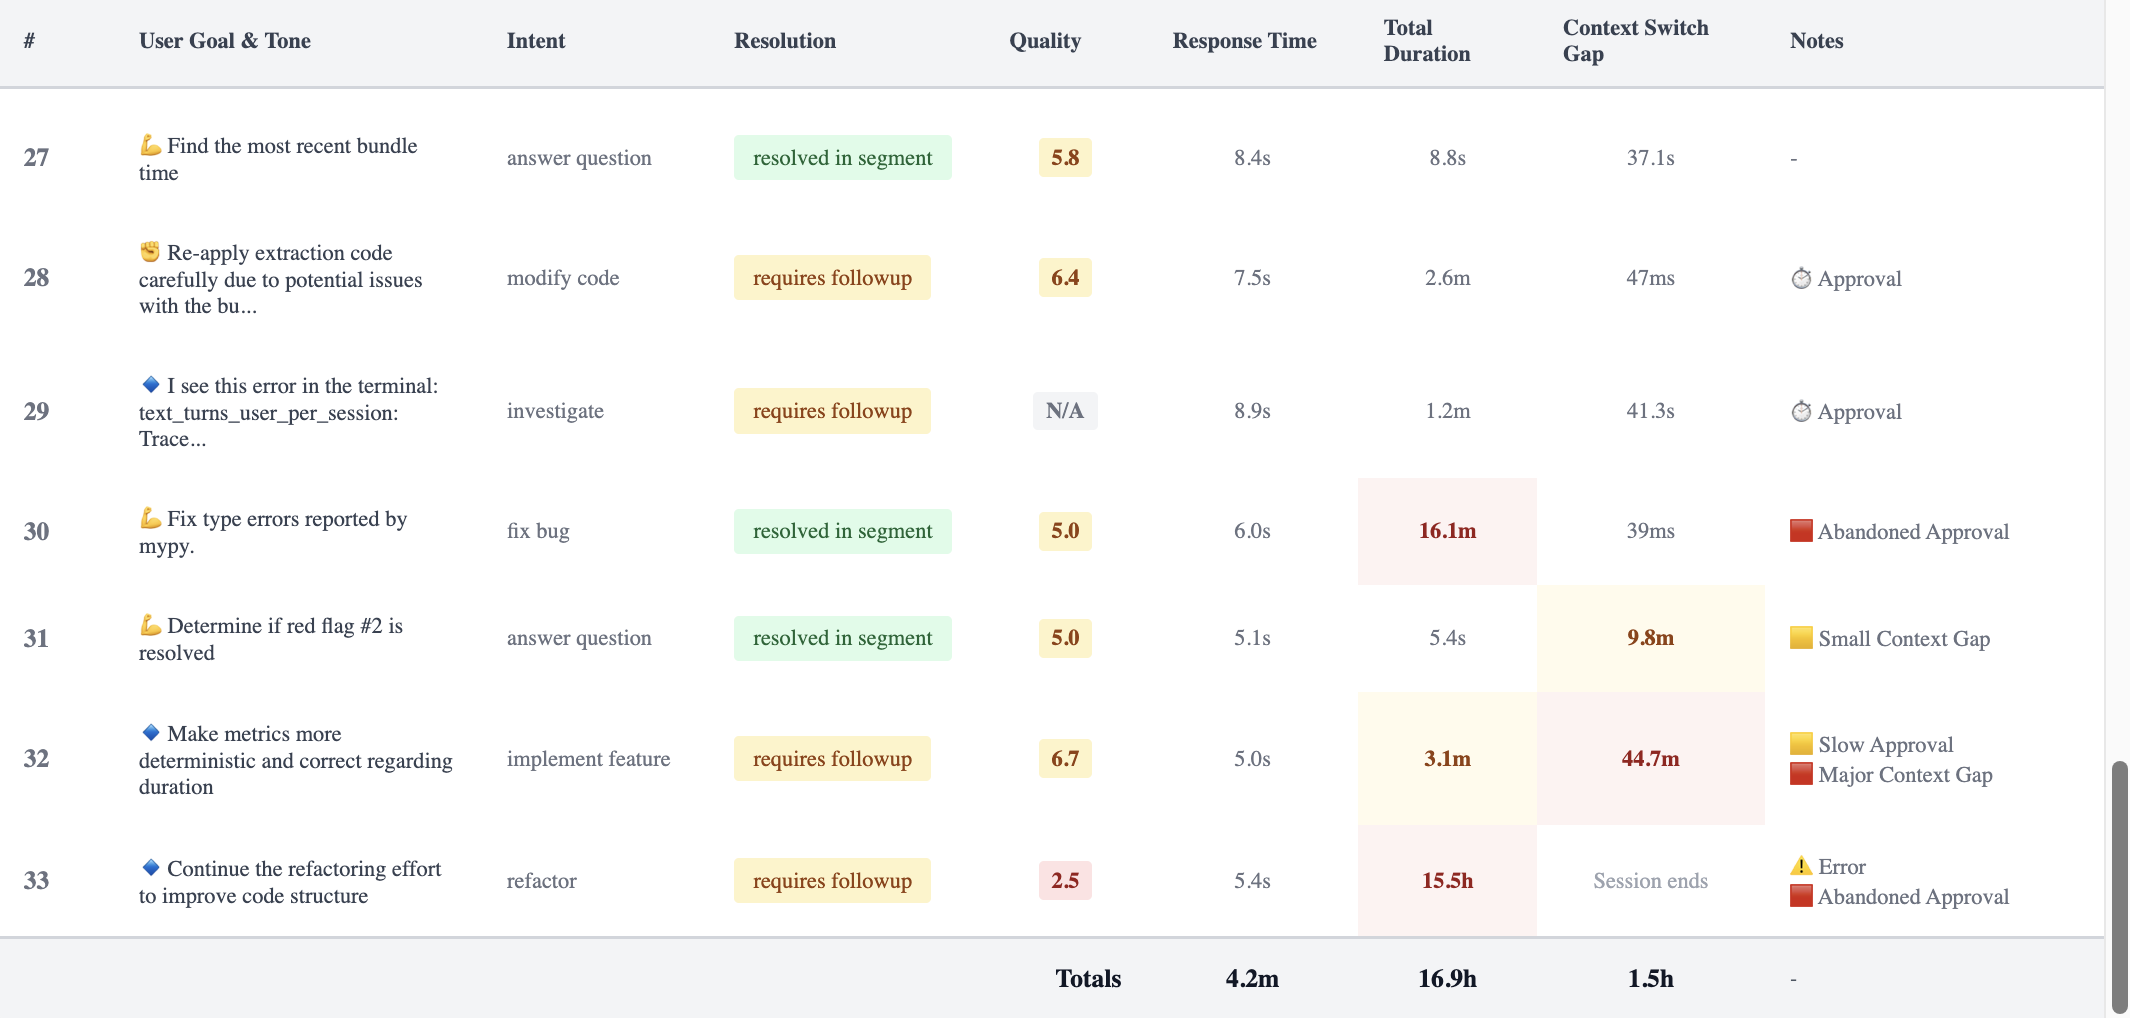
Each row is one segment. Response Time is AI latency. Total Duration is the clock on the wall. The flags in the Notes column are where the session fell apart.
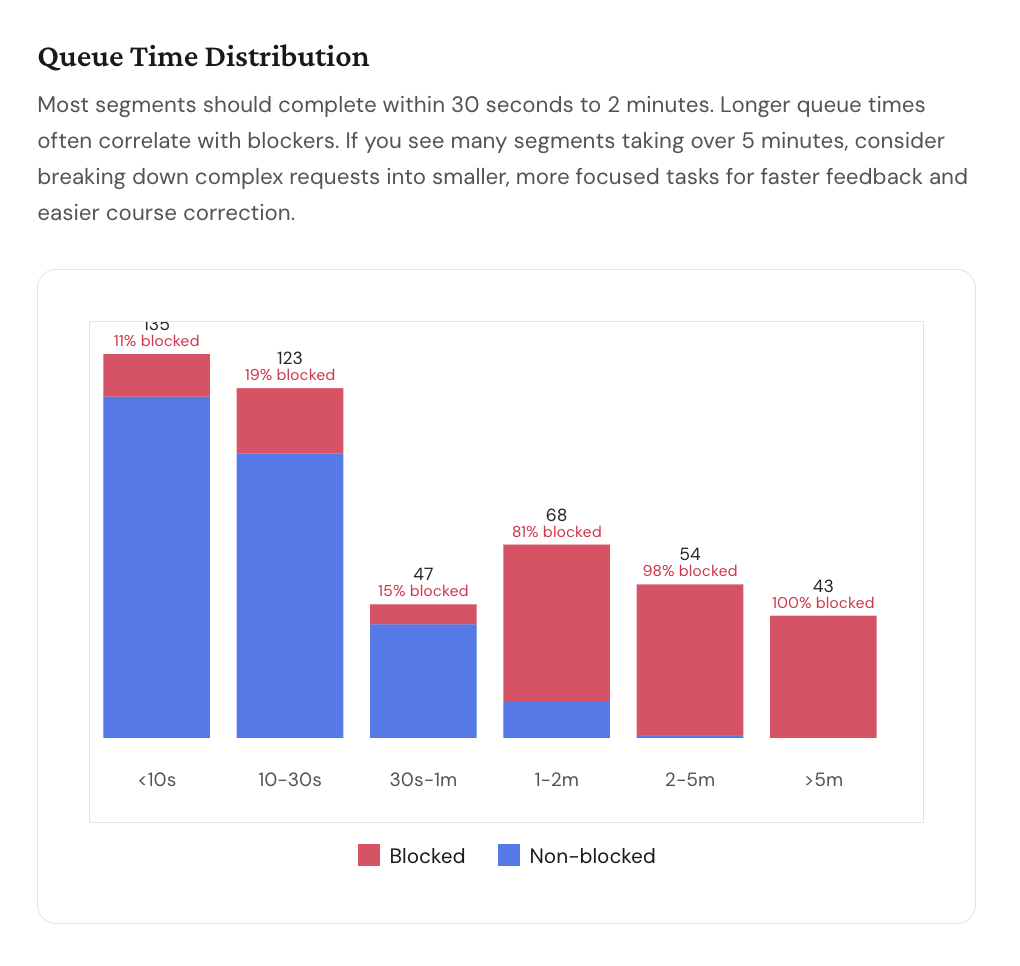
Blue is non-blocked. Red is blocked. Every segment over 5 minutes is 100% red.
The queue time distribution made the pattern undeniable. Under 10 seconds: 11% blocked. 10–30 seconds: 19% blocked. 30 seconds to 1 minute: 15% blocked.
At 1–2 minutes: 81% blocked. At 2–5 minutes: 98% blocked. Over 5 minutes: 100% blocked.
Every segment that took more than 5 minutes ended up blocked - meaning the agent had finished its work, requested permission to take the next action, and was sitting in a queue waiting for me. The AI wasn't slow: the AI was done, but I was the blocker.
A segment is classified as blocked deterministically, not inferred: the raw Copilot log records whether each tool approval was manual (human clicked) or automatic (pre-approved by rules), and the 60-second threshold is a hard cutoff. When a segment contains tools that require approval and more than a minute elapsed, the flag is set. No model judgment involved.
I had configured Copilot agent mode to require manual approval before executing terminal commands, making file edits, or searching the codebase. The intent was reasonable: oversight, error prevention, staying in control. What the data showed was that I had created a system where I was the approval queue - and I was an unreliable one. I'd send a prompt, watch the agent start working, get pulled into something else, come back 20 minutes later, click approve, and wonder why the session felt disjointed.
As Taylor Swift put it: "It's me, hi. I'm the problem, it's me."
The part that stings: my approval rate for the three most common tools - terminal commands, file editing, and file search - was 100%. Every request was approved, but I was adding minutes of delay to every interaction for zero actual safety benefit.
This data needs careful interpretation, though. Human pauses at approval gates aren't inherently bad - a 15-second pause before approving a terminal command means someone actually read what the agent was about to run. Short gaps between segments could mean you're reviewing the output, thinking through whether the approach is right, or planning the next step. That's not friction. That's the oversight the tool was designed to support.
The long tail is the problem. A 20-minute gap between prompt and approval isn't a careful review - it's distraction. And the failure mode runs in both directions: the developer who takes an hour to click approve is losing flow efficiency, but the developer who clicks approve-approve-approve through every terminal command without reading them could be a security risk. The coaching conversation isn't "how do I go faster." It's "what's the right level of attention at the right moment" - quick validation for a file read, deliberate review before a destructive operation, and an intentional handoff when you actually need to step away.
You've Seen This Before
In traditional software delivery, the two biggest killers of flow efficiency are PR size and review lag - not because reviewers are slow, but because work sits idle while engineers move on to the next ticket. Context gets stale, and every context switch compounds the delay. You fix it by reducing batch size and enforcing single-piece-flow: don't pick up new work until the work in front of you is done. The variable that matters is wait time, not active work time.
What I found in my Copilot data is structurally identical. The agent completes a task, raises its hand, and waits. The developer doesn't act. While the AI agent can easily pick up where it left off, the human's context decays. The next prompt lands without the setup it needed, and the session starts to degrade.
My 4% productive time figure isn't a rounding error - it's a flow efficiency ratio computed directly from two timestamps the Copilot log records for every segment: firstProgress (when the agent produced its first output) and totalElapsed (when the segment closed). Aggregated across 470 segments, the AI was executing for 4% of the time the sessions were open.
The other 96% was queue - me not being there to click a button.
The 1.7-hour average context switch gap is the AI equivalent of a developer picking up a task, setting it down for an afternoon, and returning cold. We've known what that costs in traditional workflows for years. It costs exactly as much here, but we just haven't been measuring it.
Same Tool, Different Jobs
To see whether this was just me, I ran the same analysis on session data from two colleagues.
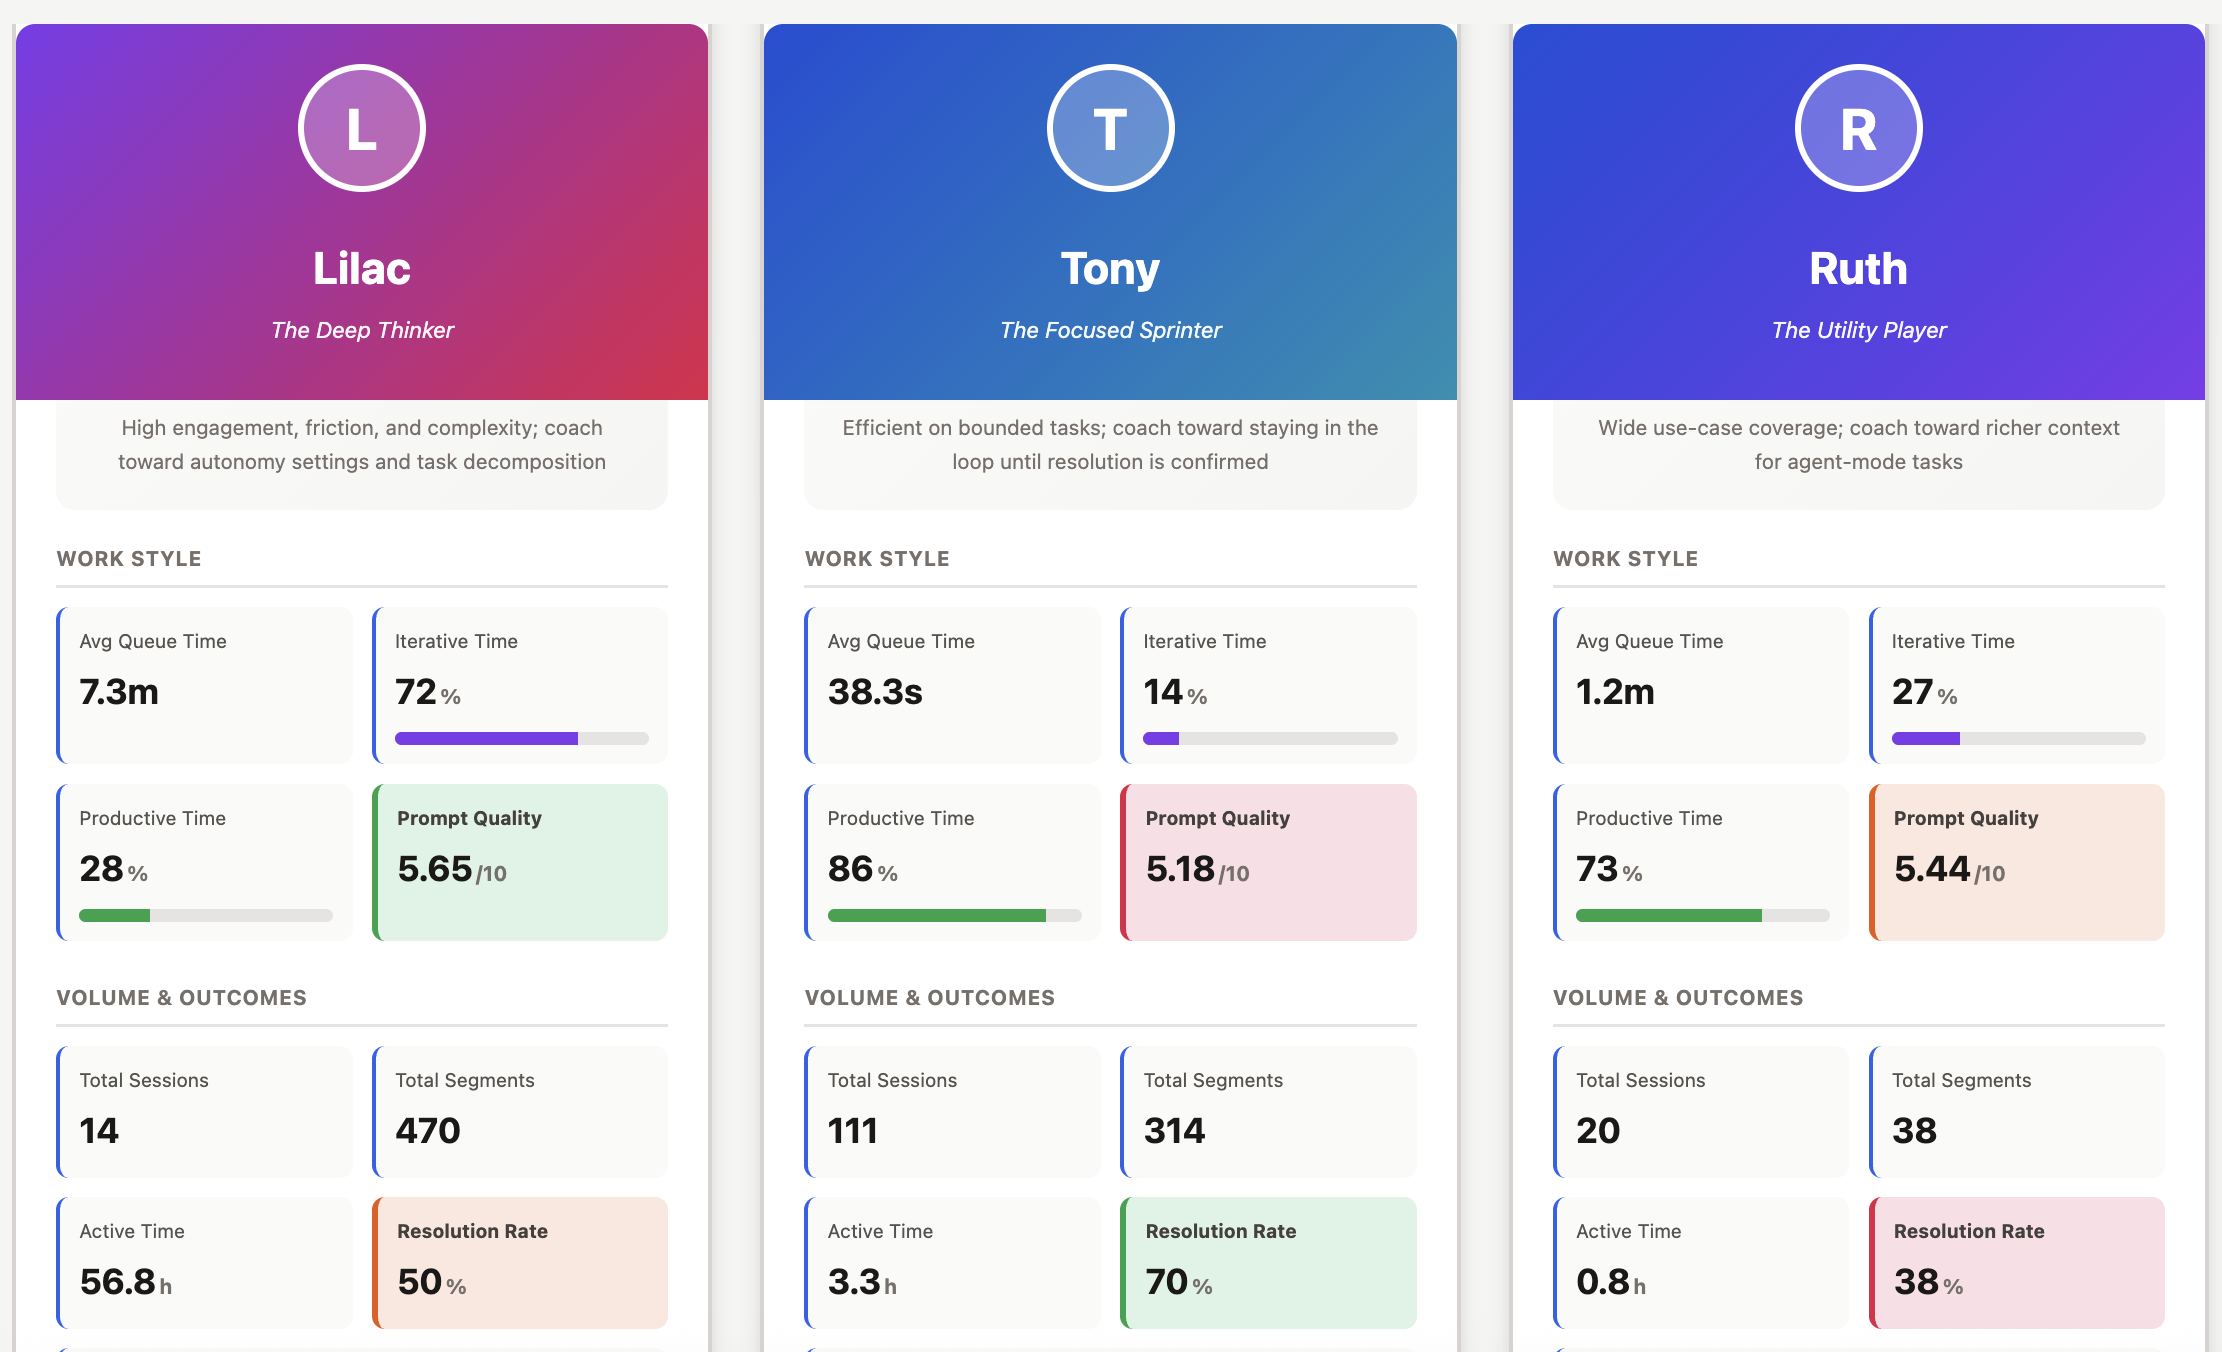
Same tool. Very different flow profiles.
I was building internal tools - giving Copilot detailed specs and guiding it through full features, staying in the orchestrator role rather than writing code directly. Tony is a Senior Engineer who uses AI for higher-order technical problem-solving across codebases. Ruth is an Engineering Manager who uses it primarily for communication, documentation, and knowledge work. (Names changed.) Same tool. Very different jobs.
Before reading the table: resolution rate is the share of segments where the agent completed the task in a single prompt-response cycle with evidence of success. The alternatives are requires_followup (partial), blocked (couldn't proceed), or needs_clarification (prompt too vague). It's an LLM classification, not a deterministic one - directional signal, not ground truth.
| Lilac | Tony | Ruth | |
|---|---|---|---|
| Archetype | The Deep Thinker | The Focused Sprinter | The Utility Player |
| Segments per session | 33.6 | 2.8 | 1.0 |
| Avg queue time | 7.3 min | 38.2 sec | 28.2 sec |
| Productive time | 4% | 85% | - |
| Resolution rate | 50% | 70% | 75% |
| Manual approvals | 111 | ~3 | 0 |
| Non-coding AI use | No | No | Yes - all sessions |
Tony has the flow efficiency I was hoping I had. His average queue time is 38 seconds and his productive time is 85% - he drops into agent mode with a bounded problem and gets out. But his data surfaces a different failure mode: he consistently uses inline chat for bug investigations that span multiple files, which means the agent is reasoning from pasted error messages rather than reading the actual code. Short sessions that look efficient can mask incomplete resolution.
Ruth's use is the broadest of the three. Doc review, knowledge lookup, communication drafting, tooling questions - and she's the only one who regularly uses AI for non-coding work, which is genuinely underappreciated as a productivity multiplier. A 9-second turnaround on a polished engineering-wide Slack announcement has a real ROI that no coding metric captures. Her main friction is prompt specificity: "How to do enums?" has no language context, no serialization requirements, no project constraints. The model inferred reasonably from her open workspace, but left the door open for a better follow-up. Her session data shows she moved on without one. A more specific prompt would have saved that cycle entirely.
The pattern across all three is that nobody is in the productive middle. Deep agentic engagement creates approval bottlenecks and context switching. Shallow episodic engagement leaves most of the agent's capability untapped. The likely sweet spot - something like focused 5-to-8-segment sessions with auto-approval configured for trusted tools - isn't represented by any of us.
Don't read that resolution rate column as a performance ranking. It isn't. Ruth is drafting Slack messages and reviewing docs. I'm debugging multi-hour data pipeline invariants with complex correctness constraints. Comparing resolution rates across fundamentally different task types without normalization is worse than useless - it's exactly the kind of out-of-context comparison that does real harm when individual metrics reach the wrong audience.
Four Developer Archetypes
The three of us represent three of the four patterns the dashboard classifies. Each has a characteristic signal, a characteristic failure mode, and a specific coaching focus. The fourth - the Balanced Builder - is the pattern nobody in this dataset represents, which is itself a finding.
| Archetype | Signal | Failure mode | Coach toward |
|---|---|---|---|
| The Deep Thinker | >15 segments/session; high iterative time; heavy approval gate usage | Approval queue bottlenecks; context degradation across long sessions | Auto-approval for trusted tools; shorter, more decomposed sessions; a persistent instructions file to avoid re-establishing context each session |
| The Focused Sprinter | <5 segments/session; fast queue time; low iteration | Ends sessions at "requires followup" without confirming; uses inline chat for multi-file investigations that need codebase access | Verifying resolution before closing; switching to agent mode for work that spans files |
| The Utility Player | Wide intent diversity (docs, comms, code, tooling); short sessions; balanced iteration | Vague prompts on technical tasks; accepts generic answers without realizing specificity would materially improve output | Applying the context and success-criterion framing that works naturally in communication work to technical prompts |
| The Balanced Builder (target state) | 5–15 segments/session; moderate iterative time; focused task scope with resolution verification | No failure mode observed - this is the aspirational pattern | Sustaining the pattern; experimenting with auto-approval to reduce residual queue time |
The Focused Sprinter and Utility Player archetypes are defined partly by prompt quality signal - the dashboard scores each prompt across clarity, specificity, context, and actionability. A Utility Player with consistently high prompt quality across diverse intents is a different coaching conversation than one whose technical prompts score three points lower than their communication prompts. The table generalizes; the actual coaching starts from the individual data.
The Engineers Who Weren't Using It
None of us represents what is probably the most common use case: the engineer working directly in a production codebase, fixing bugs, writing new features, jumping into the code when AI misses something. So I ran the same analysis on three engineers doing exactly that work.
What I found wasn't what I expected. They weren't using AI agents at all. Their sessions were sporadic - occasional questions, debugging only when they were stuck - not sustained agentic workflows. Where I had 33 segments per session on average, they had 1 or 2. The data pattern looked nothing like mine or Tony's.
When I talked to them individually, the reason was consistent: they didn't trust the output. AI-generated code in their production codebase required so much revision that it was often faster to just write it themselves. The agent wasn't slow. It just wasn't reliable enough - in their context, with their codebase - to be worth the overhead of reviewing and correcting what it produced.
If the problem isn't how engineers are interacting with AI but whether they're interacting with it at all, the coaching conversation is different. You're not optimizing queue time - you're working on trust. And trust in a production codebase is an enablement problem. Engineers working without shared AI context, no instructions files, no retrieval layer, and no established patterns for what good output looks like are going to default to skepticism. That's a rational response to an agent that doesn't know the codebase conventions, the architectural constraints, or the team's standards. The agents aren't misconfigured - they just don't know enough about the work yet.
The next question isn't what production engineer patterns look like in isolation. It's what changes when they're better equipped: instruction files capturing codebase conventions, retrieval systems with relevant architectural context, shared prompt libraries for common task types. If the coaching conversation for adopters is "optimize your interaction patterns," the coaching conversation for non-adopters is "before we talk about how you use AI, let's make sure the AI knows enough about your codebase to be worth using." Those are fundamentally different problems, and the session data is what tells you which one you have.
The Dashboard Isn't the Coaching
The dashboard tells you where friction exists - the queue time distributions, the blocked segment share, the context switch gaps. But it doesn't explain why, and it doesn't generate the specific, personalized recommendations that actually change behavior.
After building the dashboard, I started sending the enhanced session data to an LLM and asking for a coaching report for each developer, specific to their actual patterns. The pipeline doesn't send raw code or file contents to the model - each segment is first converted to a redacted case file with prompt excerpts, assistant summary, error signatures, and deterministic metrics. No code goes to the annotation model.
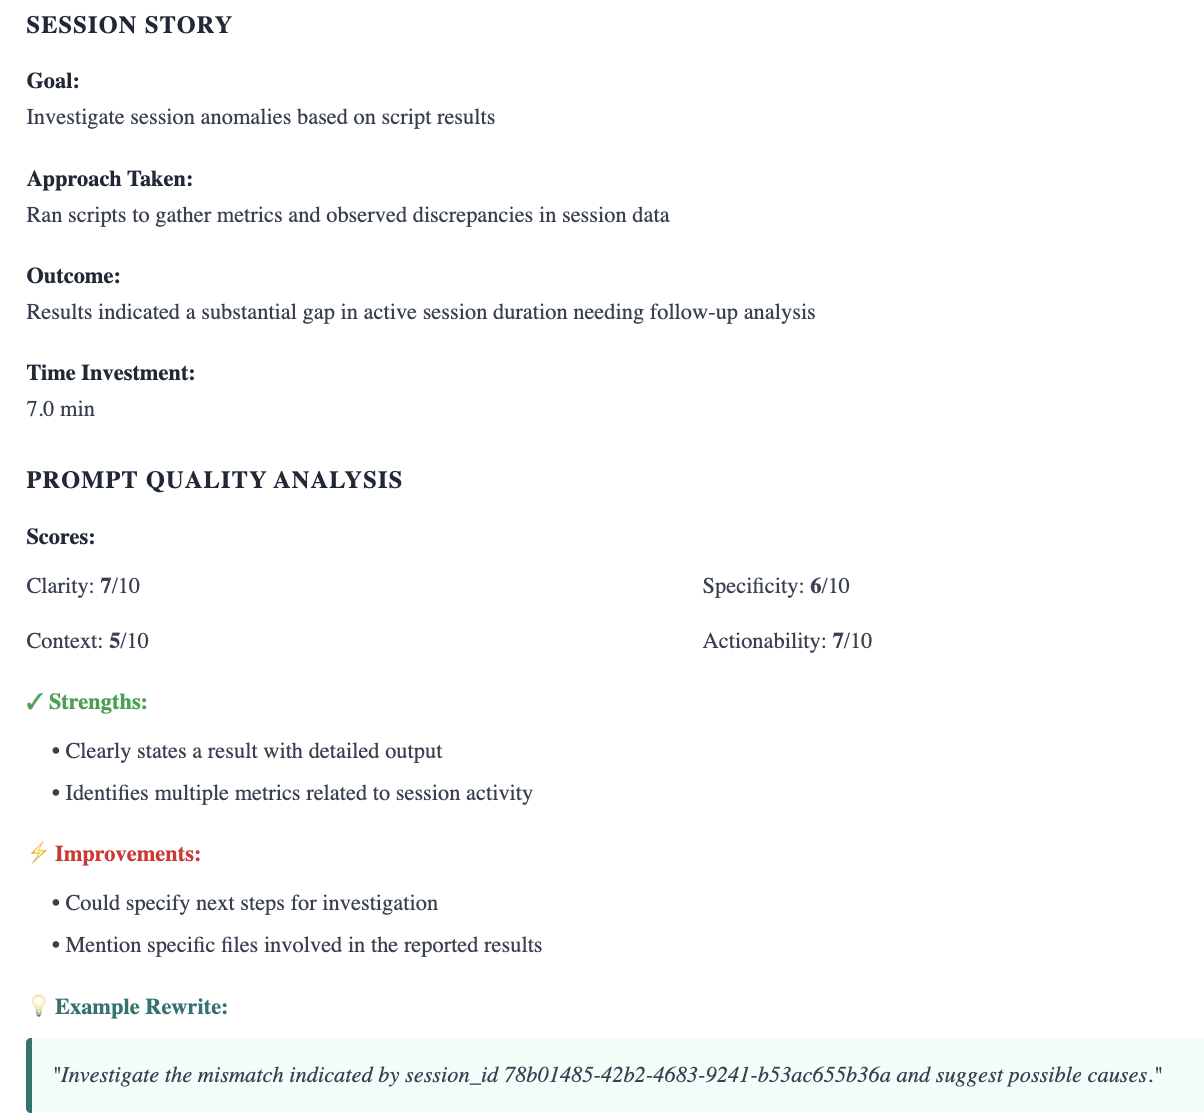
The coaching report for a single segment: what was attempted, how the prompt scored across four dimensions, and a suggested rewrite.
For my own sessions, that analysis surfaced things the dashboard could point to but not explain: that I was re-establishing Copilot's context for my virtual environment in the first 3–5 prompts of almost every session - something a simple instructions file would fix permanently - and that my longest, most carefully structured prompts were correlated with my worst resolution rates. The opposite of what I expected.
For Tony, the report flagged the inline chat pattern specifically: he was consistently using a mode that gives the agent no codebase access for investigations that required it, and his sessions were ending at "requires followup" without a verification step. A habit of handing off rather than confirming.
For Ruth, the analysis connected her best outputs - the communication drafting work - to a natural behavior she wasn't consciously applying elsewhere: providing context and a clear success criterion. Her technical prompts were missing both. The framing that worked well in one context wasn't transferring to the other.
The cadence I'm building: the dashboard identifies the friction and points to the pattern. A monthly LLM-generated coaching report translates the pattern into specific, actionable recommendations for that developer. Discuss both in 1:1s. Track what changes. It's the same structure we used at Flow - behavioral data used to start coaching conversations, not to end them.
None of us has an optimized workflow yet. The developers who will get the most from these tools are the ones who approach it as a practice - looking at their patterns honestly, experimenting with what the data suggests, and adjusting. The dashboard and the coaching report aren't answers. They're a structure for asking better questions on a regular cadence, with data to ground the conversation.
Why Your Developers Will Be Nervous About This
Before an engineering leader gets excited about bringing this kind of measurement to their team, they should sit with one thing first: developers are going to have concerns about this data, and those concerns are legitimate.
We have been here before. At GitPrime and Pluralsight Flow, we built tools that turned Git activity into behavioral signals and used those signals to start better coaching conversations. That work did genuine good. It also caused real harm in organizations where the design principle - the data is for the developer first - got inverted. I watched developers grow anxious about their commit frequency appearing in executive dashboards. I watched teams game metrics that were never designed to be gamed. I watched tools designed to start conversations become the things that ended careers. None of that was inevitable. All of it was predictable.
AI interaction data is even more sensitive territory. C-suites have declared AI-first mandates, executives are watching adoption metrics, and developers aren't naive about what that means. An engineer who knows their manager can see how often they use AI - in an environment where AI is supposed to make everyone more productive - is going to do the math. That anxiety is a rational response to real incentive structures, not an overreaction to manage away.
How you introduce this data matters as much as what you measure.
The dashboard I built is deliberately structured as a coaching tool, not a visibility tool. A developer sees their own data first, in a 1:1 or peer group where they've opted in. No executive dashboard, no stack ranking, no individual metrics surfaced to a skip-level without context. The design isn't just an ethical choice - it's what makes the data useful. A developer who believes their manager will see their blocked segment share before they do will optimize for the metric. A developer who encounters their own data in a low-stakes context, recognizes something true in it, and decides to change - that's how it actually works. I know because it happened to me. I didn't change because someone told me I was the bottleneck. I changed because I saw it myself and couldn't unsee it.
For team-level analysis, aggregate patterns - average blocked segment share, distribution of resolution rates, how iterative time shifts after a workflow change - can be shared broadly without any individual feeling exposed. Aggregate data answers a different question than individual data: not "what would help this person?" but "do we have a systemic problem?" Those conversations need to stay clearly separated, both because it's more ethical and because conflating them destroys the trust that makes the individual data useful in the first place.
Three questions worth answering before you bring this to your team:
Who sees it first? If the answer is anyone other than the developer themselves, reconsider.
What decisions is it allowed to inform? Coaching yes. Performance reviews or headcount decisions, no.
What is it explicitly off the table for? Write this down and say it to your team before the data is live, not after someone finds their prompt quality score in a quarterly business review.
Where to Start
The session data is already on your developers' machines. GitHub Copilot is logging it right now. The question is whether anyone is reading it.
Measure queue time alongside AI latency. The AI is fast. The meaningful question is whether developers are keeping up with it. Queue time tells you where the human is the bottleneck.
Track flow efficiency, not just activity. A session with 100 tool calls and 0 resolutions looks productive if you measure volume. Blocked segment share and value-added time give you a ratio that actually tells you something.
Look at breadth of use, not just code generation. Developers who use AI across their full workday - documentation, communication, knowledge lookup, tooling - are capturing more value than those who treat it as a code completion shortcut. That pattern deserves its own coaching conversation.
Pair the dashboard with a regular coaching report. The dashboard points to the friction. A monthly LLM-generated report, built from the actual session data, tells each developer what specifically to change - what to add to their instructions file, which settings to configure, what habits are costing them. Neither is sufficient on its own.
Invest in enablement before optimizing interaction patterns. Engineers who don't trust AI output enough to use it consistently aren't a coaching problem - they're a setup problem. Instruction files, retrieval systems with relevant architectural context, and shared prompt libraries for common task types can shift the baseline from sporadic querying to sustained use. Measuring interaction patterns before the infrastructure is in place will tell you less than you think.
Design the data access model before you design the dashboard. The organizations that will get the most from this are the ones that make developers feel safe enough to look honestly at their own patterns. That requires design decisions made upfront, not retrospective reassurances.
The Questions I'm Still Asking
I started this project expecting to find some interesting usage data. What I found instead was a familiar analytical framework applied to a context where almost nobody is applying it yet - and a set of questions I don't know how to answer.
What is the right engagement depth for different kinds of work, and can it be measured? Do long structured prompts help or hurt resolution rates, and does that vary by task type? What happens to these patterns when engineers make more intentional model selection choices? What does production engineer adoption look like once the enablement infrastructure is in place - and does better-configured context shift the pattern from sporadic querying to sustained collaboration?
At the next meetup where someone asks how to coach AI-assisted development behaviors, I want the answer to stop being silence and a shrug toward acceptance rate. The behaviors that matter in AI-assisted development are visible in the data. The data to identify them already exists. The coaching conversations that would help developers get more from these tools are the ones we've always been willing to have - they just need a new set of signals to point to.
We built an entire discipline around the idea that engineering productivity is not a feeling, but a discussion that can be augmented with metrics. The discipline doesn't stop applying because the tool changed. What changes is what we measure.