
The year was 2022 and AI coding was in its infancy: wobbly, overhyped, and electric with possibility. I remember sitting in a meeting when a VP announced that our AI coding assistant had "written 67% of our code last quarter." The room nodded approvingly and the VP sat back in his chair. The evidence seemed clear that the GitHub Copilot mandate had worked and AI would soon be delivering the 10x developer productivity improvement all the news headlines were promising. The meeting moved on.
As a Senior Director at the time, something felt off to me. It was true that engineers had complied with the requirement to install the AI assistant plugin on their IDEs. But I hadn't heard much about the topic from the team since, other than occasional grumbles about the hype. I pulled the actual data that afternoon and discovered that the 67% was autocomplete acceptance rate. AI autocomplete had made suggestions on closing brackets, completed variable names, filled in imports, and the like. The developers accepted most of these suggestions and likely saved themselves a couple of keystrokes, but most IDEs had been equipped with IntelliSense for years. Nothing revolutionary was happening here.
Curious, I peeked at our real productivity data: Was PR throughput increasing? Were cycle times improving? Were there reductions in the Change Failure Rate? Nope. Our coding, collaboration, delivery, and quality metrics hadn't changed since the introduction of AI coding assistants.
That was 2022. AI coding agents have improved dramatically since then. Their capabilities have moved far beyond autocomplete. Yet I keep seeing this same pattern repeat. The CEOs making headlines about how much of their code AI is writing are measuring the same thing: lines of code and acceptance rates. Those numbers make great press, but in software engineering we've always known that activity isn't impact.
The Autocomplete Shell Game
Here's what I've observed: most AI coding metrics measure suggestion acceptance, not autonomous work. An engineer hits tab to accept a closing brace. The AI gets credit for "generating code." Multiply that across thousands of developers and millions of keystrokes, and suddenly you have impressive-sounding statistics that mean almost nothing about actual productivity gains.
The distinction matters because autocomplete assistance and autonomous code generation require completely different enablement strategies. When you measure autocomplete acceptance and call it "AI-generated code," you're measuring developer ergonomics and claiming you've measured developer productivity. The gap between those two things is where most AI strategies are failing right now.
What Are We Even Measuring?
The problem starts with language. When executives report "AI-generated code" percentages and researchers measure autonomous agent adoption, they're often not counting the same thing. A shared vocabulary:
| Term | What it actually measures |
|---|---|
| AI suggestions accepted | % of AI-generated suggestions developers choose to integrate (autocomplete acceptance rate) |
| AI-assisted code | Human controls logic and direction; AI contributes syntax, boilerplate, and pattern completion |
| AI-generated commits / PRs | Commits or pull requests authored by agentic tools with minimal human rewriting |
| "AI-written code" (exec reporting) | Typically undefined; often based on suggestion acceptance or tool utilization rates |
This ambiguity plays out at the highest levels. On Google's Q4 2025 earnings call, CFO Anat Ashkenazi said "about 50% of our code is written by coding agents, which are then reviewed by our own engineers." In a conversation with Mark Zuckerberg at Meta's LlamaCon in April 2025, Microsoft CEO Satya Nadella said 20–30% of Microsoft's code was "written by software." Both statements made headlines. Neither defined what "AI-generated" meant in practice.
Even developers making their own estimates are careful about the word they choose. Sonar's 2025 State of Code survey found developers estimate 42% of committed code is AI-assisted, not autonomous, not generated, but assisted.
The vocabulary confusion isn't academic. It shapes strategy. Whether you're evaluating your own team's AI adoption or parsing a CEO's earnings call, two things matter:
- Define terms consistently. Autocomplete acceptance and autonomous code generation are not the same metric, and treating them as equivalent will send your investment in entirely the wrong direction.
- Measure activity separately from impact. A high acceptance rate tells you how often developers hit tab. It doesn't tell you whether they're shipping faster or better.
What Autonomous Actually Looks Like
Most organizations I've worked with still rely primarily on AI assistants for suggestions, answering questions, and inline coding help. To advance to the next level, teams need to trust AI-generated code and have frameworks for working with autonomous agents, something I'm still figuring out myself.
In late 2025 I built a PR intelligence pipeline where large language models analyze code changes, extract patterns, and produce insights.
The code was 100% AI-generated, with me in the role of agent orchestrator and project manager. The agents wrote the analysis logic, the data transformations, and the classification systems. I wrote the orchestration, reviewed the architecture, and cleaned up edge cases. But the core functionality? The AI wrote it.
Thanks to the AI agents' capabilities, I completed this side project in three days, with most of my time spent on other tasks. Without AI agents, the same project would have taken months. That's well beyond 10x productivity. Is there a metric that captures that kind of time savings?
This project also points to a measurement problem that goes deeper than accuracy: it's something I wouldn't have taken on without AI agents. The time trade-off against my day job wouldn't have been worth it.
Anthropic's internal research on their own engineers found that more than 25% of AI-assisted work consisted of tasks that simply wouldn't have been done otherwise: work previously deemed too time-intensive to attempt. That's not a productivity improvement. That's net-new value creation. No acceptance rate metric captures it.
This is why I'm not trying to find the perfect measurement. I'm trying to find a proxy that's closer to value than what we have now, which for most teams is acceptance rates and lines of code.
What to Track Instead
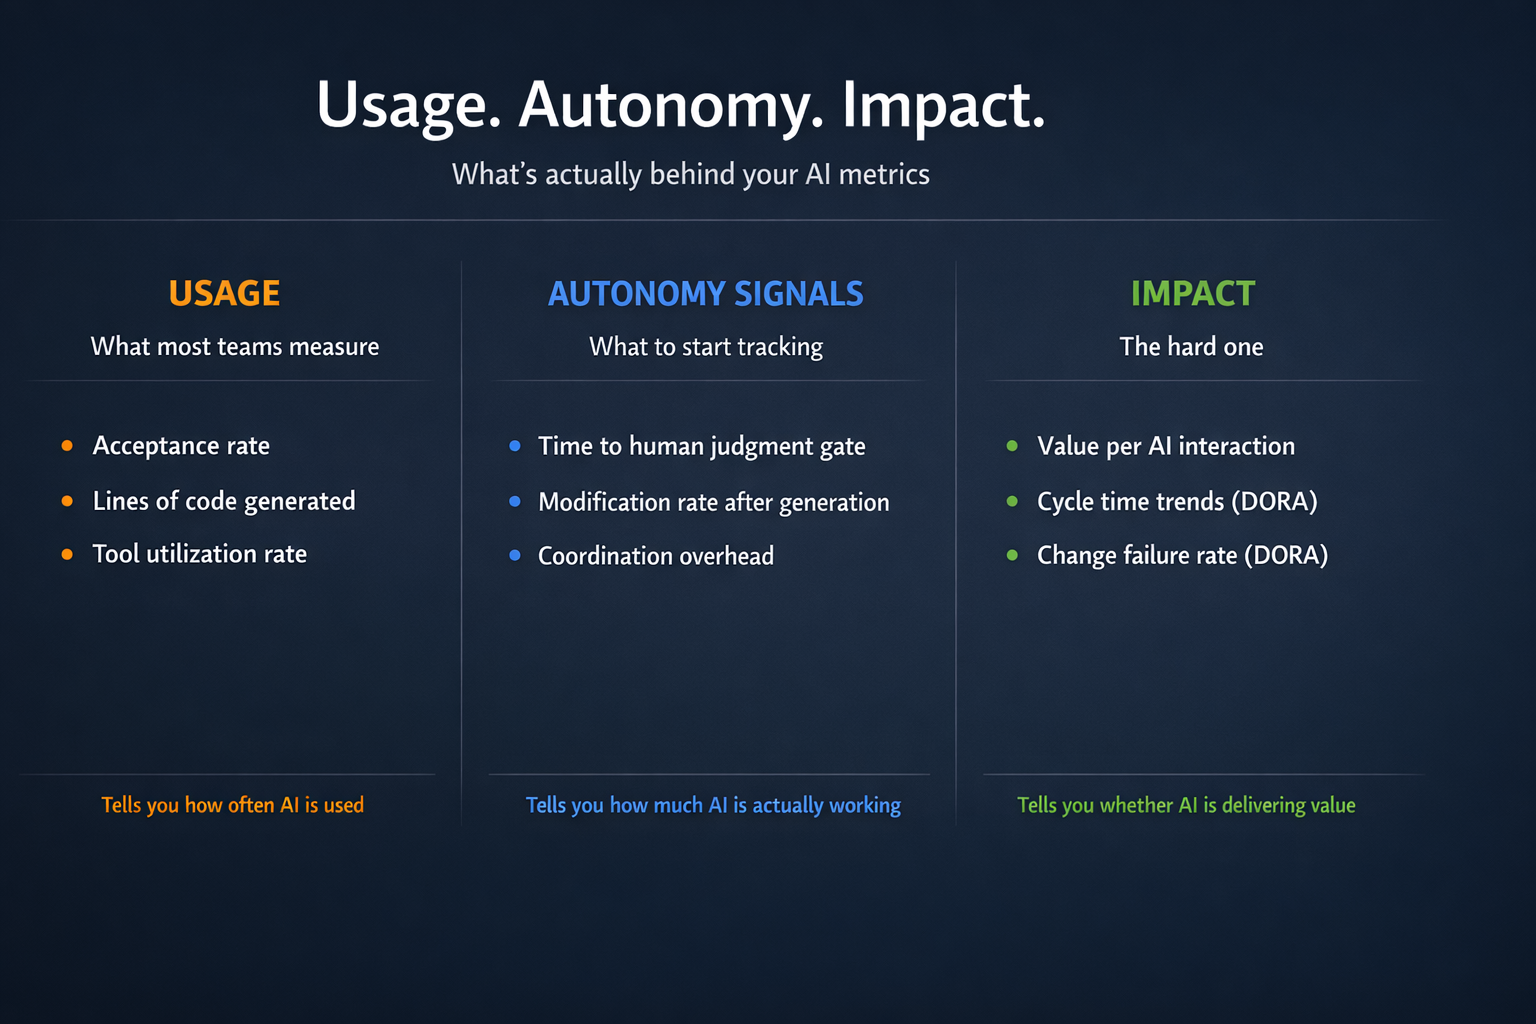
Usage, autonomy, and impact are three distinct things, and they require different signals. The first three metrics below are autonomy signals: they tell you how much of the work AI is doing without human intervention, and where the human/AI handoffs are actually happening. The fourth is where impact measurement starts - but it needs to be read alongside the DORA and velocity metrics your team is already tracking to mean anything.
Here's what I'm experimenting with and why:
Time to human judgment gate. How long before the work needs a person to make a decision? For autocomplete, it's seconds. For autonomous agents, it's hours or days. This tells you whether AI is assisting or actually working. In my PR pipeline, the judgment gate comes when I review the weekly insights report; everything before that runs without me. I recently built a tool to analyze Copilot interactions and map where human judgment gates actually appear in practice.
Modification rate after generation. What percentage of AI-generated code does the engineer accept without rewriting before it ever reaches a PR? This is the immediate feedback loop: the diff between what the AI produced and what actually gets committed. It's not code churn, PR revision cycles, or change failure rate; those measure what happens after the code is in review or production. This metric measures trust at the moment of generation. If everything needs immediate human revision, you're measuring assistance, not autonomy. Both are valuable, but they're not the same thing. For my pipeline, the modification rate is under 5%. For most teams using coding assistants, it's closer to 80-90%.
A recent Jellyfish Research study across 90M AI suggestions from GitHub Copilot, Cursor, and Claude Code illustrates both how much progress is being made on this problem and where the instrumentation still breaks down. The study's W1–W4 framework - categorizing tools by workflow tier rather than forcing them onto the same acceptance rate scale - is the right direction. Copilot inline completions and Claude Code file approvals aren't doing the same thing; measuring them identically obscures more than it reveals. But even that careful framework hits the same wall. The study found near-zero Claude Code revert rates and framed it as a potential signal of output quality. What the data can't see: declining a Claude Code suggestion terminates the agentic session. Users learn quickly that saying no is expensive - you lose the agent's context and momentum - so they accept and fix things quietly afterward, in follow-up commits that don't register as reversions. The metric looks like trust. It may be a UX tax. The real signal is exactly what modification rate would capture: how much developers change Claude Code output after accepting it, before it ever reaches a PR. That signal disappears upstream of any analytics platform. The problem isn't that the research is wrong. It's that the instrumentation gap exists before the data is collected.
Coordination overhead. Did the AI reduce or increase the number of human handoffs? True autonomous work reduces coordination. I've seen assistance increase it by creating more review burden. The 2025 DORA report on AI-assisted software development confirmed what the 2024 report first flagged: AI adoption correlates positively with throughput but negatively with stability. DX's own Q4 2025 AI Impact Report, drawing on data from 135,000 developers across 435 companies, found the same pattern from a different angle: meeting-heavy days and interruption frequency ranked as the single biggest obstacles to productivity — outweighing the time AI saves. Daily AI users who gain hours writing code can lose more than that to organizational friction that AI doesn't touch. The dysfunction was already there; AI just makes its cost more visible. The 2025 DORA report's framing is sharper: AI acts as an amplifier, not a fixer. Teams with high coordination overhead before AI will find AI makes it worse. That's exactly why measuring coordination impact matters: if your AI adoption is accelerating throughput while quietly degrading stability, you won't see it in your acceptance rate dashboard.
Value per AI interaction. What did the output enable that wouldn't have happened otherwise? A thousand autocompletes might save a couple minutes. One autonomous agent might save days or weeks. This is the hardest metric to pin down, and I want to be honest about why: it's a counterfactual problem. You can't run the same project twice: once with AI, once without. That's not a tooling gap; it's a structural measurement challenge, the same one that makes it hard to quantify the ROI of a great IDE or a mature CI/CD pipeline. Two imperfect proxies I'm experimenting with: tracking the backlog age of tasks completed with AI (if something sat deprioritized for months and AI finally made it feasible, that's a signal), and a single retro question: "What did you complete this sprint that you would have deprioritized without AI?" Qualitative, but patterns emerge quickly. I'd rather be transparent about the gap than pretend acceptance rate fills it.
Of these four, modification rate is conceptually the most tractable, but it has a real instrumentation problem. By the time code lands in a PR, the story behind the human / AI interaction is gone. Git history tells you what changed, not what the AI originally wrote. You can capture this signal at the IDE layer if your tooling exposes it, or informally if developers credit AI in commit messages, but neither is consistent or reliable at scale. I'm still looking for a clean way to instrument this and haven't found one. The other metrics require even more work to pull. I'm currently writing some custom tools for extracting and analyzing some of this data. For now, asking these questions in a team retro is a great temperature check for understanding how AI is being used and where value is being added.
For actual impact, none of these four metrics tell the full story on their own. You need to track value per AI interaction as a trend, alongside the DORA and velocity metrics you're already running. If cycle times are improving and change failure rate is holding steady as autonomous work scales, that's a far more credible signal of impact than any acceptance rate dashboard. That's a conversation a CTO can actually have with a board.
Why This Matters Beyond Vanity
"When a measure becomes a target, it ceases to be a good measure."
- Goodhart's Law
Measuring the wrong thing doesn't just inflate your numbers. It shapes your strategy in ways that actively hurt you.
If you think you're at 80% AI-generated code because of autocomplete acceptance, you might decide you've "solved" AI adoption. You'll miss the actual opportunities for autonomous work. You'll under-invest in the orchestration infrastructure that makes true autonomous possible. You'll keep optimizing for faster tab completion when you could be building agents that work while you sleep.
I've watched leaders celebrate their teams' AI metrics while actual velocity stayed flat. The engineers knew the real story: AI was helping with syntax, but it wasn't touching the things that actually slow teams down - unclear requirements, integration complexity, coordination overhead, technical debt. Typing speed was never the bottleneck. The vanity metrics painted a picture of adoption, not value. They gave leaders enough good news to stop looking, while the gap that actually mattered - how far most teams still were from any meaningful autonomous work - stayed invisible.
What I'm Still Figuring Out
I've stopped reporting aggregate "AI-generated code" percentages on my teams - they're meaningless without context about what kind of AI interaction you're measuring. Instead, I track the three categories separately: suggestions accepted, AI-assisted code, and AI-generated commits. But I don't have clean answers to everything else. The measurement frameworks are still evolving, and honestly, we're all learning as we go.
What I'm watching for: How do you measure the cognitive overhead of reviewing AI-generated code versus writing it yourself? The time saved in generation might get consumed in review, but I haven't found a good way to instrument that yet. How do you account for the fact that AI might help individuals move faster while creating coordination bottlenecks at the team level? The metrics I've described above are directional, not definitive.
What I do know: teams that distinguish between autocomplete and autonomy make better decisions about where to invest in AI tooling. Teams that don't are optimizing for the wrong constraint and wondering why their velocity isn't improving.
The goal isn't more code. It's more value delivered per unit time. Sometimes that means writing code faster. Sometimes it means writing less code, or better code, or more maintainable code. AI can help with all of those, but only if you're measuring the right things.
When someone tells me their team is writing 80% AI-generated code, I ask them: "Is that autocomplete acceptance or autonomous work?" The conversation that follows is usually more valuable than any dashboard I could build.