
I've been in two situations where the project ended without warning: once when a product was canceled after eight months with nothing shipped, and once when I came back from lunch to find the lights off and a final paycheck waiting. Both times, code was being written, velocity looked normal, and the managers were still saying we were on track. The collapse was a complete surprise and left me shaken.
From those experiences, I developed a reflexive suspicion of anything that smells like a waterfall project - "agile in name only," I'm looking at you - and an interest that extended well beyond coding into every aspect of software delivery. I wanted to understand why good teams with good intentions so often end up somewhere they didn't expect.
I've come to believe that most of the damage happens in the dark, in the parts of the delivery process nobody's measuring. And with agentic AI in the picture, some of what used to be visible is getting harder to interpret.
The Streetlight Effect
You may already be familiar with the cognitive problem of the Streetlight Effect. A man is searching for his keys under a streetlight, not because that's where he dropped them, but because the light is there and it's easier to search where you can see. It describes an observational bias we see in data science as well: we measure what's easy, then look for solutions in the areas that are well lit.
Where is the light in the software delivery space?
The last decade of agile, lean, and DevOps practices moved the industry in the right direction. We have more light than we used to:
- Flow visibility - Kanban boards and WIP limits make work-in-progress legible, so teams aren't working on ten things at once.
- Delivery cadence - Sprint velocity and burn-down charts give teams a rhythm and a rough gauge of throughput.
- Deployment pipeline - The four key metrics from Accelerate (deployment frequency, lead time for changes, change failure rate, and time to restore) gave engineering leaders a shared vocabulary for measuring DevOps maturity.
These are genuinely useful, and for many teams, getting them in place was hard-won progress. But they share a common limitation: they measure specific segments of the value stream well, and leave the rest in the dark.
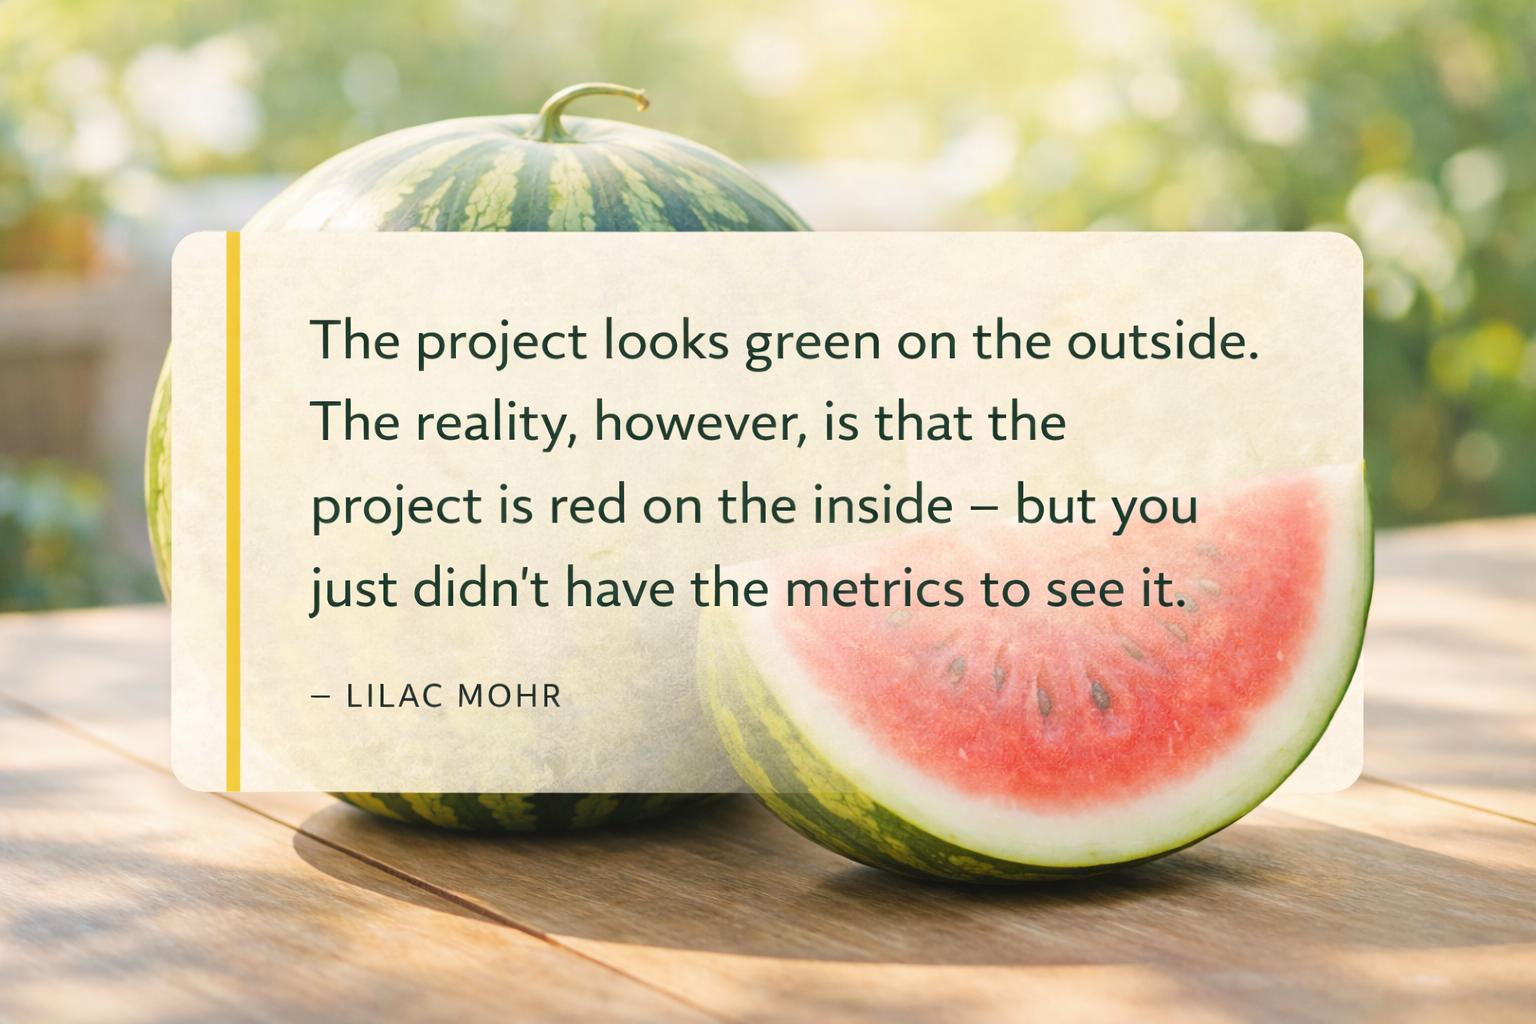
The Watermelon Effect
When teams measure only what's easy, the result is the Watermelon Effect.
The project looks green on the outside. The team appears confident - status updates are positive, the board is moving, engineers are busy. When the committed delivery date passes, the color shifts to yellow: it's "almost there," just a few loose ends to tie up. Then yellow quietly becomes a new normal. Weeks stretch into months. By the time the project is officially late - sometimes very late - no one can pinpoint in the retrospective where the warning signs were. That's the defining feature of a watermelon project: it looks green long after the inside has turned red. The metrics you had were measuring activity. Nobody was measuring progress.
I've seen this play out enough times that I'm now reflexively suspicious of delivery dashboards where everything looks good. Teams are usually not intentionally trying to mislead anyone. But the dashboards are built around metrics that are easy to capture. This means they reflect the parts of the process that are most visible, not necessarily the parts that matter most.
Knowledge Work Is Messy By Nature
Measuring the inside of a software project is genuinely hard. Like the interior of a watermelon, it's messy in there.
I love this observation from Mary and Tom Poppendieck's Lean Software Development: "development is not intended to produce repeatable results; development produces appropriate solutions to unique customer problems."
Unlike manufacturing, which has a predictable, highly visible process, software engineering is knowledge work. It has a lot of variance. It's not a linear process but a complex network of people, tools, and interactions. Compounding the complexity, every organization has its own unique process. Even within the same company, feature teams define their own workflows, their own definitions of done, their own branching strategies, their own review conventions.
So what do we do? Do we throw up our hands and say "it's knowledge work, so it's unpredictable by nature"?
Of course not. An organization's ability to stay competitive, to grow, to stay relevant - all of it depends on delivery. Predictability isn't just a nice-to-have. It's a strategic asset.
The nature of software engineering means it will have variation. But that doesn't mean you can't improve your process and increase predictability. You just need more light.
Illuminating What Actually Matters
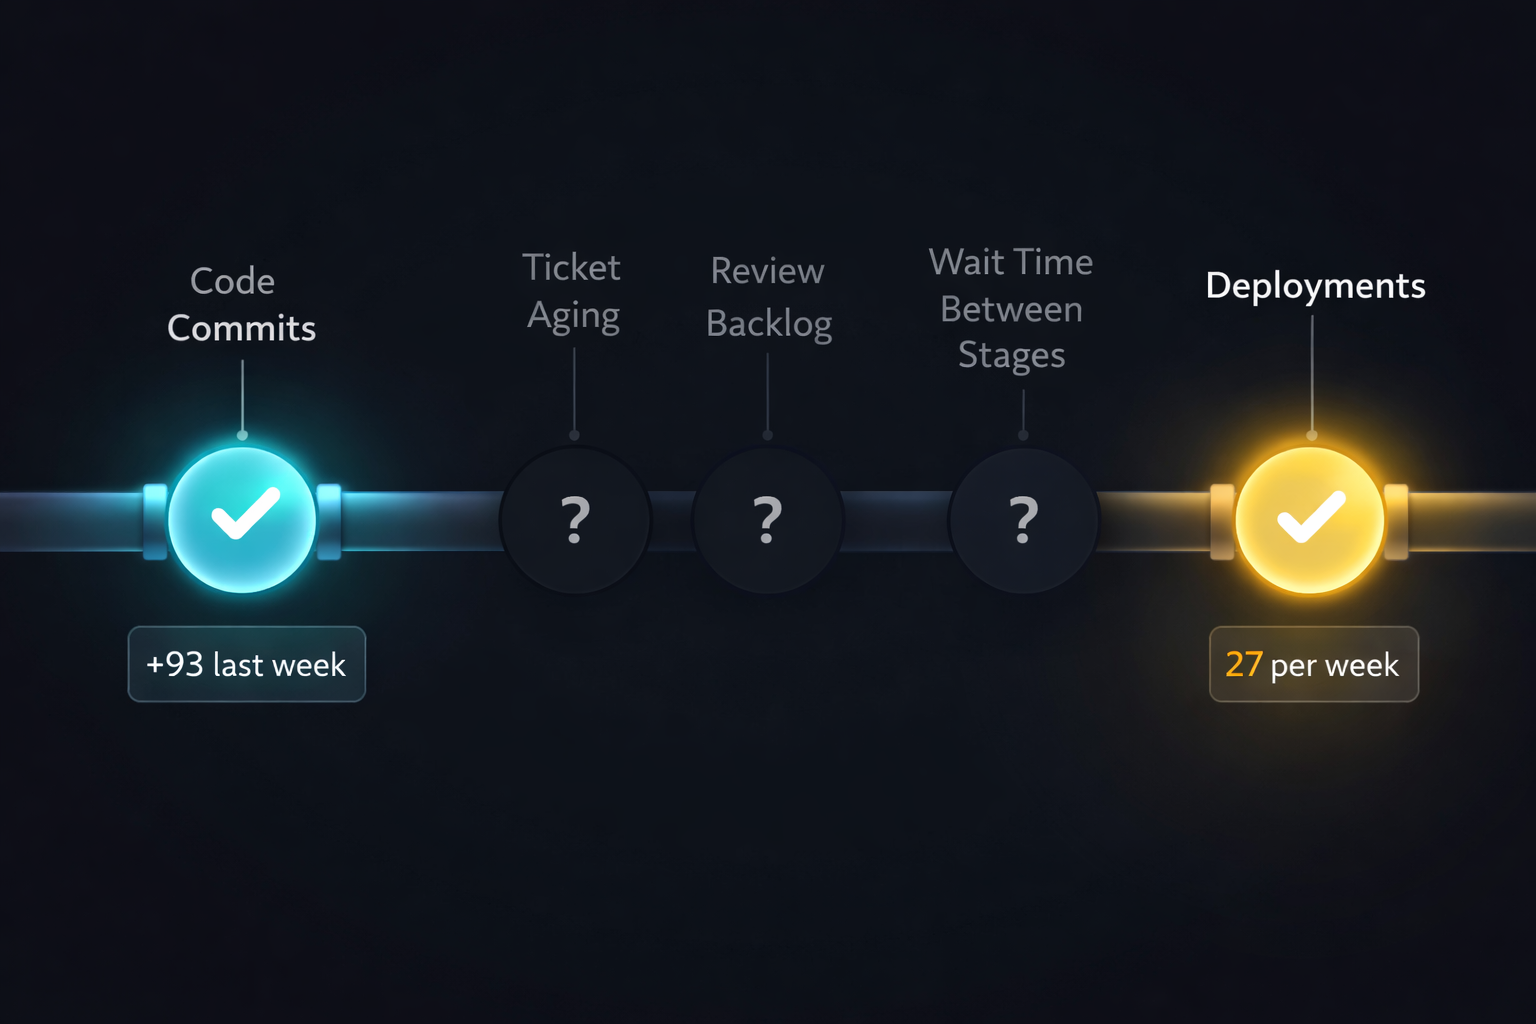
Most teams have good visibility into code-level activity: commits, pull requests, review times, deployment frequency. What tends to remain in the dark is the end-to-end picture - how those activities connect to each other across the full value stream, and where work is actually getting stuck.
The right questions are uncomfortable ones. Where are your tickets spending time? Is work piling up in a particular stage? How long does it typically sit waiting for review, and does that vary wildly from sprint to sprint? How much of a ticket's total lifetime is actually active development versus waiting for something? When teams can answer these questions with data, they stop optimizing the wrong segment of the pipeline.
The practical starting point is mapping your actual value stream - not the idealized one in your team norms document, but the one your tickets actually move through. Most teams discover that the real process has more stages and more variance than they thought. And once it's visible, you can start asking which stages are predictable and which ones are chaotic, and why.
The signals I've found most revealing are:
- PR cycle time - the total elapsed time from PR open to merge. High variance here is often the first sign that something is wrong; a team with consistent cycle times is a team with a legible process.
- Time to first review - how long PRs sit unread after opening. This is almost always wait time, not active time, and it's one of the easiest bottlenecks to see once you're measuring it.
- PR size - larger PRs take disproportionately longer to review and are more likely to sit. If your average PR is touching dozens of files, your review process is probably a bottleneck whether it looks like one or not.
- Wait time vs. active development time - what fraction of a ticket's total lifetime is someone actually working on it, versus it sitting in a queue? Most teams are surprised by this ratio when they see it for the first time.
The problem with these signals historically has been instrumentation. Pulling them together into something legible required either expensive tooling, a dedicated data engineering effort, or both. That's changed.
In early 2026 I built a PR analysis dashboard that tracks cycle time, time to first review, PR size, risk indicators, and collaboration patterns across our repositories. The whole thing - data ingestion, analysis pipeline, and dashboard UI - came together in a couple of days, with AI agents doing the majority of the implementation work. I defined what I wanted to see, reviewed the architecture, and cleaned up edge cases. The agents wrote the rest.
The point isn't that I built something clever. It's that the barrier to building your own visibility tooling has dropped dramatically. A dashboard that would have taken months of data engineering effort two years ago is now a realistic two-day project for an engineering leader who can describe what they want to measure.
What the Data Showed
The first thing that surprised me wasn't a problem - it was a gap between what I assumed was true and what was actually true.
Before I ran this, I would have told you our average PR cycle time was under a day - not ideal, but decent for a globally-distributed team. The data told a different story. The median PR cycle time was 22 hours, but the average was 64 hours. The median looked healthy, but it was hiding the outliers that actually matter for delivery risk. When I looked at the distribution shape rather than the summary statistics, I saw something I hadn't noticed: a small cluster of PRs was consistently taking five to seven days, and they weren't random. They were concentrated in specific areas of the codebase. That's not a process problem, but a signal about complexity, unclear ownership, or work that needs to be broken down differently. I would have called that project "green" right up until it wasn't.
The time-to-first-review numbers told a similar story. The median TTFR was 1.3 hours, which sounds like a responsive team. The average was 31 hours. Both numbers are true. Only one of them tells you something useful about delivery risk. Ten PRs waited over two days for a first review. Six open PRs had received no review at all. If any of those slow-TTFR PRs were on the critical path of something, there was a hidden two-day slip baked into the cycle, one that never surfaced in standup.
The PR size data had a pattern I hadn't named yet. I knew we had some large PRs occasionally. What the metrics showed was that "occasionally" wasn't the right word. The cycle had 35 small PRs under 10 lines, 15 large PRs between 100 and 499 lines, and 3 very large PRs over 500 lines. Roughly one in four PRs was large or very large. Asked before I ran this whether my team was writing small, iterative PRs, I'd have said "mostly yes." The data says 25% of the time, no - and that's not a rounding error. That's a quarter of the review load carrying disproportionate risk, every cycle.
The four largest PRs - 926 lines, 787 lines, 604 lines, 572 lines - aren't abstractions. You can look at that list and immediately have a different kind of conversation than "we should try to write smaller PRs." The 787-line PR touched 10 files; the 926-line PR touched 4. One is sprawling across the codebase; the other is a deep vertical cut. They're different problems with different solutions, and the metrics don't just tell you that something is large. They start to tell you how, which changes what you ask the author to do differently next time. The 926-line PR wasn't a one-off judgment call. It was evidence of a recurring habit that nobody had named yet. Once you can name it, you can have a conversation about it.
The review participation data was the finding that stayed with me longest. I knew roughly who reviewed what, the way any manager knows - through observation and Slack. What I didn't know was that the review graph had a quiet dependency problem. The comment-depth numbers told the story: 128 total comments across 255 reviews. That's 0.5 comments per review. More than half of all reviews produced no written comment at all. Of the comments that did exist, 44 were short, 73 were medium, and 11 were long. Reviews where someone actually wrote a substantive thought represented 4% of all reviews. You could describe a review culture as "active" and be technically accurate while completely missing that 96% of those reviews left no substantial feedback. A disproportionate share of substantive reviews were coming from one or two people. The others were approving, but the comment data showed most of those approvals had nothing behind them. If either of those two reviewers goes on vacation or leaves, the review process doesn't slow down - it collapses.
One more number: four PRs closed without merging in a single cycle. That's not a lot in isolation. But if each one represents even half a day of engineering work, that's two-plus engineer-days that produced nothing and showed up nowhere in velocity metrics. More importantly, there was no record of why they were abandoned. Were the requirements unclear? Did someone discover a technical dead end? The number alone isn't the signal, but the absence of an explanation is.
What This Means for Delivery Confidence
Before I had these metrics, my sense of whether a project was on track was assembled from signals like standup updates, Slack tone, how often someone was asking for help. Those signals are real, but they lag. By the time you feel a project going sideways, you're already behind.
What the PR data gives you is a leading indicator layer. Cycle time trending upward mid-sprint, before anyone has said anything in standup? Worth a conversation. TTFR on a critical-path feature still sitting at 18 hours on day three? That's a flag. A cluster of large PRs queued at the same time? That's a review bottleneck about to form.
None of these are alarms. They're questions - the kind that let you have a calm, curious conversation on Tuesday instead of a stressful escalation on Friday. The goal isn't to catch people doing something wrong. The goal is to see around corners that the "everything is fine" reporting structure doesn't let you see around.
The honest version of "this project will be delivered on X date" requires knowing not just whether tickets are moving, but whether the work is moving cleanly - small, reviewable, getting real feedback, merging without drama. PR metrics don't give you certainty. They give you a much better foundation for the confidence you're already expected to project.
Every one of these data points was sitting in my Git history the whole time. None of it required new tooling to generate - just the decision to look. The question isn't whether your team has these patterns. Every team does. The question is whether you're the engineering leader who knows what yours are.
How Agentic AI Changes the Predictability Discussion
Everything in that data section was possible for one reason: engineers leave traces. Commits, pull requests, review comments, and closed-without-merge events all land in Github, where it sits waiting to be analyzed. The visibility problem was never a data availability problem, but an instrumentation problem. You had the evidence. You just hadn't looked at it.
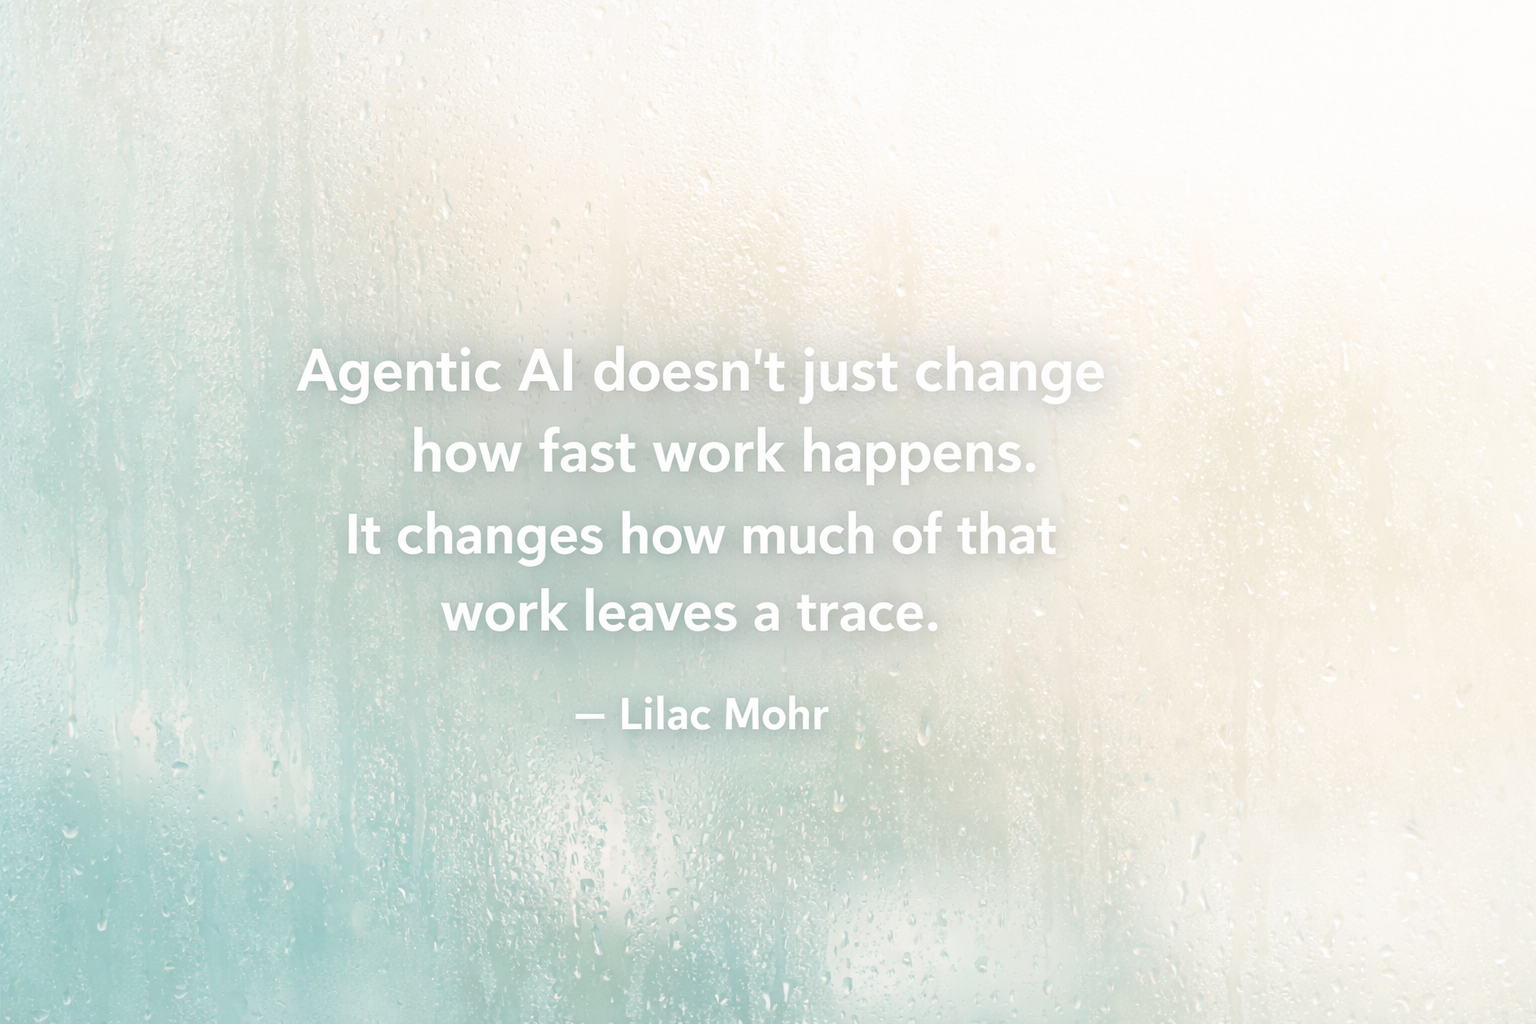
Agentic AI is quietly changing that assumption - not by eliminating the traces, but by changing what they tell you. The PR still lands in Git. Cycle time is still measurable. PR size, TTFR, review comment depth: all of it is still there. What disappears is the layer underneath: the reasoning that produced the output.
For years, the challenge was getting visibility into a process that was complex but at least human-paced. Engineers wrote code, opened pull requests, and participated in reviews. The traces were legible because the process that created them was legible.
When AI agents are doing meaningful portions of the implementation work, a significant amount of reasoning and decision-making happens inside sessions that close without a record. The engineer opened an agent session, described a problem, iterated through a few approaches, and arrived at a solution. The code got committed. But the decisions that shaped that code - why one approach was chosen over another, what constraints were in play, what was tried and abandoned - evaporated when the session ended. Building explicit infrastructure to capture that reasoning before it disappears is something I've written about separately; see Building the Memory Layer.
The same 926-line PR means something different depending on whether it came from three days of deliberate human engineering or a 45-minute agent session you can no longer reconstruct. The signal is the same. Its interpretive value is not. That's the new dark space.
There's also a subtler effect on predictability. With human-written code, the pace of the work is relatively legible. You can look at a developer's activity and get a rough sense of where they are and what they're working through. With agentic tools, a single session can produce the output of days of manual work in hours. Progress becomes less gradual and more episodic with long periods of relative quiet followed by a large commit. That episodic pattern makes standard progress tracking less reliable.
The predictability conversation is shifting from how long will this take to what exactly happened and why - and that's a harder question to answer.
Building Predictability Into AI-Assisted Delivery
Building visibility into your value stream is only half the problem. The other half is what you do with AI-assisted work once it starts moving fast. Here's where I'd focus.
Define acceptance criteria before the agent runs, not after.
This is the delivery equivalent of knowing what you're looking for before you look. If you're sending an agent into a task without clear, testable success criteria, the review becomes a judgment call made under time pressure - and judgment calls under time pressure are how watermelon projects stay green longer than they should. Write down what "done" looks like before you prompt. Not a paragraph of intent but specific, checkable outcomes. What tests should pass? What behavior should change? What patterns should this code follow? The specification work is where predictability is either built or lost.
Size tasks for observability, not just velocity.
Large, loosely scoped tasks are risky in human-paced development. They're more dangerous with AI agents because the output is harder to evaluate in bulk. A commit that touches twenty files, generated by an agent working from a vague specification, puts the reviewer in an impossible position. Tightly scoped tasks produce outputs that are small enough to actually verify. Work that can be checked quickly and confidently is work that can move predictably.
Treat decision capture as part of the task, not documentation work.
The reasoning that shapes an AI-assisted implementation doesn't persist automatically. Building a lightweight habit of capturing why a key decision was made (before the session closes) preserves the knowledge that would otherwise evaporate. This doesn't need to be an Architecture Decision Record (ADR) or a long comment. A sentence in the PR description explaining the tradeoff is often enough. The goal is that the next person who touches this code - or the next incident postmortem - has access to the reasoning, not just the result.
Make the AI work visible in your process.
If your team is using agents for meaningful portions of implementation, that should be visible somewhere in your process. It doesn't have to be elaborate. Adding a note to your ticket when a task is significantly AI-assisted, or tagging the PR, gives you the traceability to go back and understand where rework is accumulating and why. Over time, that signal tells you which parts of your value stream are benefiting most from AI assistance and which are actually getting less predictable because the work is moving faster than your review process can absorb.
Instrument before you optimize.
The temptation with agentic tools is to focus on throughput: more tickets closed, faster cycle times, and higher commit frequency. All of those numbers can go up while the inside of the watermelon gets redder. The metrics to watch are the ones that reflect quality and comprehension: defect escape rate, rework frequency, and how long postmortems take to get to a root cause. If those are stable or improving as throughput increases, you're building real predictability. If they're quietly degrading, your delivery dashboard is showing you the outside of the watermelon.
None of these practices take root without a leader who's actively asking for them. Engineers don't spontaneously start capturing decision rationale or tagging AI-assisted work. They do it when they understand it matters, and they understand it matters when the people above them are looking at that data and acting on it. Creating the conditions for visibility is itself a leadership act.
You Still Need More Light
Software delivery has always been harder to see than it looks. The variance is real, the complexity is real, and the organizational dynamics that keep bad news from reaching the people who need it are very human and very persistent.
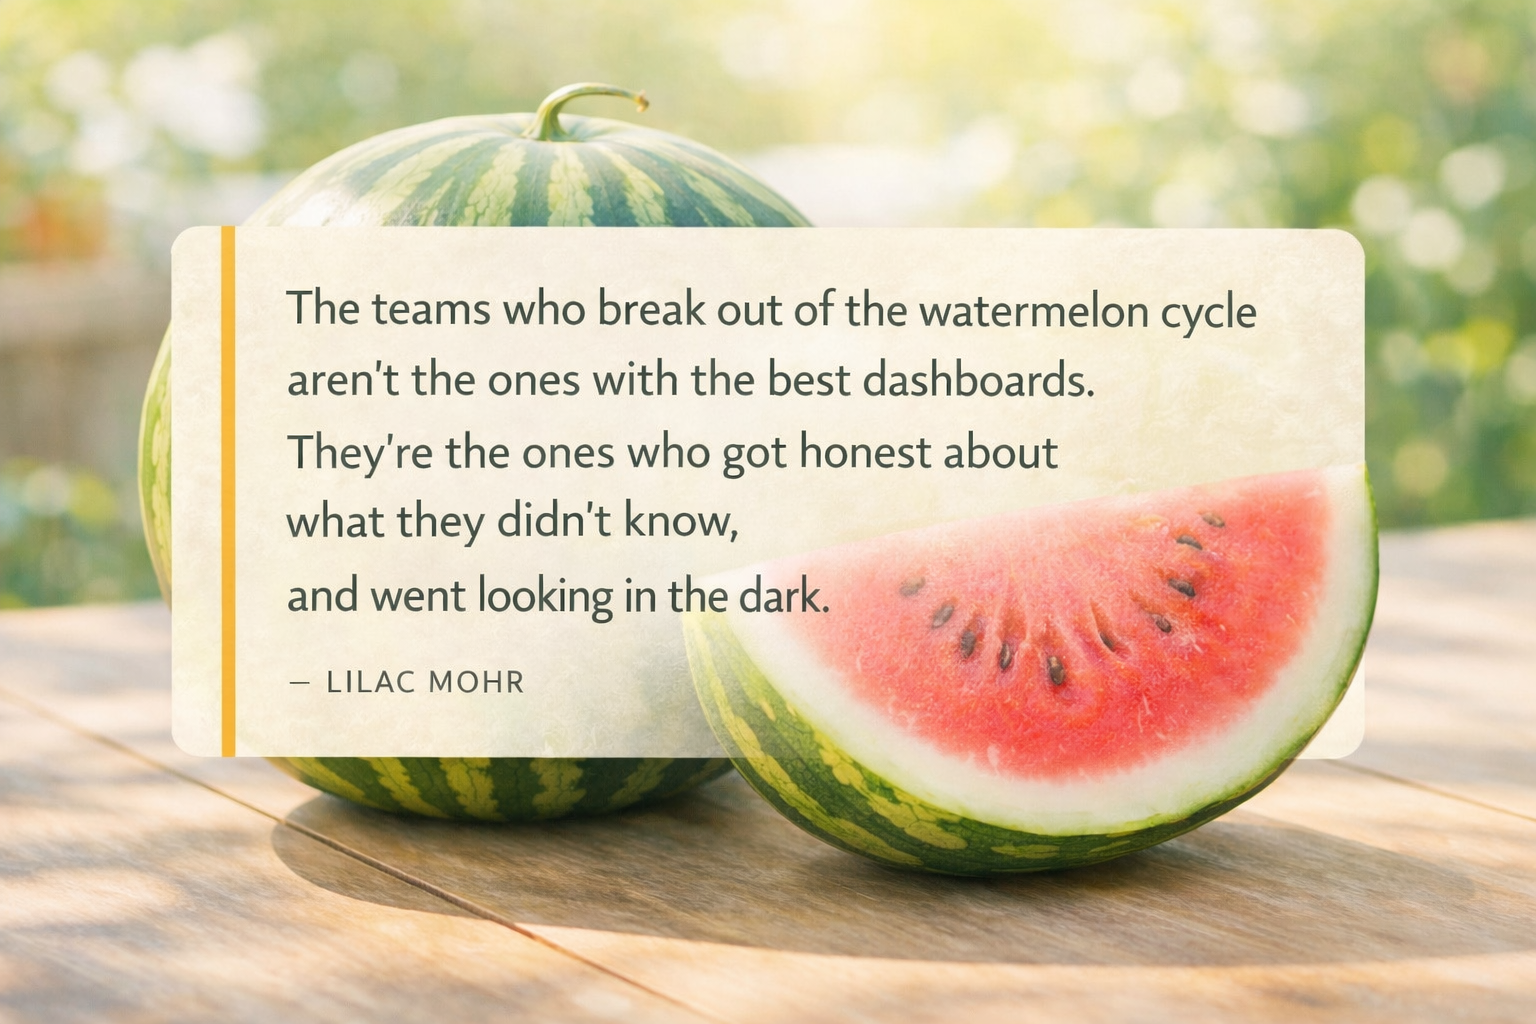
But none of that means predictability is out of reach. It means you have to be deliberate about where you put the light - in the parts of the process that are easy to measure and in the parts that matter. The teams I've seen break out of the watermelon cycle aren't the ones running the most sophisticated tools or the most comprehensive dashboards. They're the ones who got honest about what they didn't know, and went looking in the dark.
Agentic AI raises the stakes on that habit. The tools are more powerful, the output is faster, and the parts of the process that are easiest to overlook are getting harder to see. But those same tools are also what made it possible for me to build a delivery visibility dashboard in two days that would have taken months before. The leaders who figure out how to use AI to illuminate the dark spaces - not just to write code faster, but to make their own delivery process legible - are the ones who will actually ship better software. Not just more of it.
You just need more light.
Related reading: Cognitive Drain: The Silent Risk of AI-Assisted Development · Your AI Metrics Are Lying to You